CEADs Collaboration: Release of China County-Level Carbon Emissions and Vegetation Carbon Sequestration Data
1| Research Background
As global warming intensifies, CO2 emissions have received growing attention. China, as the world's largest carbon emitter, has pledged to peak emissions by 2030 and achieve carbon neutrality by 2060. In recent years, an increasing number of scholars have studied China's CO2 emissions. Due to methodological limitations and constraints in basic data sources, most estimates of China's CO2 emissions have remained at the national, provincial, or prefecture-level city scale, leaving more micro-level research relatively scarce. As China's carbon dioxide reduction strategy is implemented from the top down, more attention should be paid to carbon emissions at finer spatial scales. Compared with provincial and city-level data, county-level CO2 emissions contain richer information and can reflect regional heterogeneity in greater detail, helping government departments implement emission reduction policies according to local conditions. Although a small number of scholars have estimated CO2 emissions for some regions based on fossil energy consumption data provided by counties, their time span and spatial coverage remain very limited. Meanwhile, research on vegetation carbon sequestration at regional scales in China is even scarcer.
2| Research Results
This study uses the strong correlation between nighttime light data and human activities. Based on two sets of nighttime light data provided by NGDC (National Geophysical Data Center), namely DMSP/OLS and NPP/VIIRS data, it estimates CO2 emissions for 2,735 counties in China from 1997 to 2017. More importantly, using net primary productivity from the MODIS platform, the study calculates terrestrial vegetation CO2 sequestration data for 2000 to 2017, which is highly valuable for current research on carbon peaking projections and carbon neutrality. In addition, when calibrating nighttime light data, the study applies a particle swarm optimization back-propagation (PSO-BP) algorithm to harmonize DMSP/OLS and NPP/VIIRS satellite images, producing high-quality stable nighttime light data over a long time span. This not only advances remote sensing research, but also provides important reference value for future studies on population distribution, GDP prediction, pollutant estimation, and related topics.
Data Download
The list includes the following datasets, available at https://www.ceads.net/data/county/.
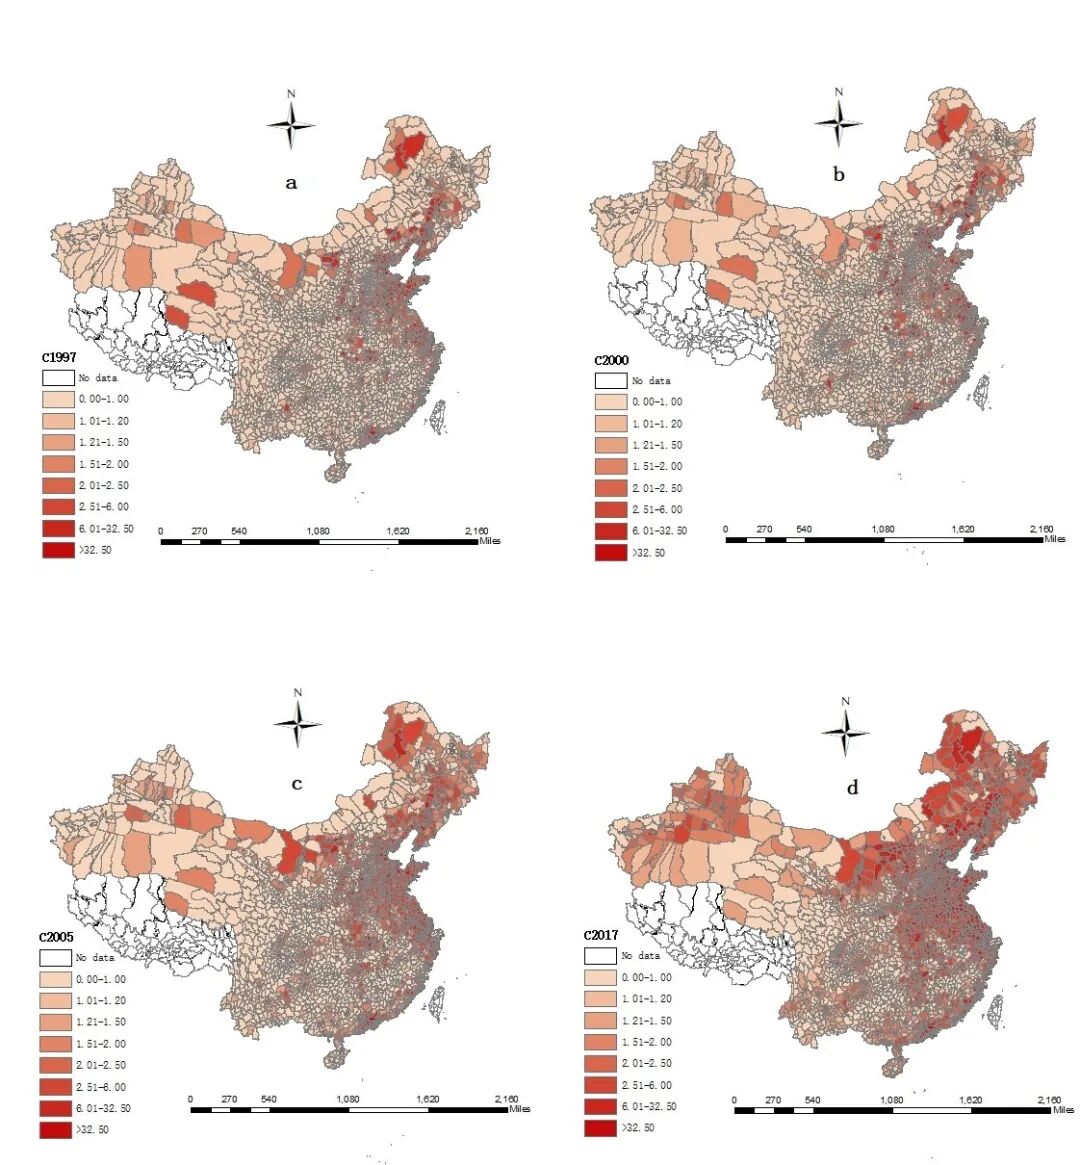
(1) Fossil energy consumption CO2 emissions data for 2,735 counties in China from 1997 to 2017
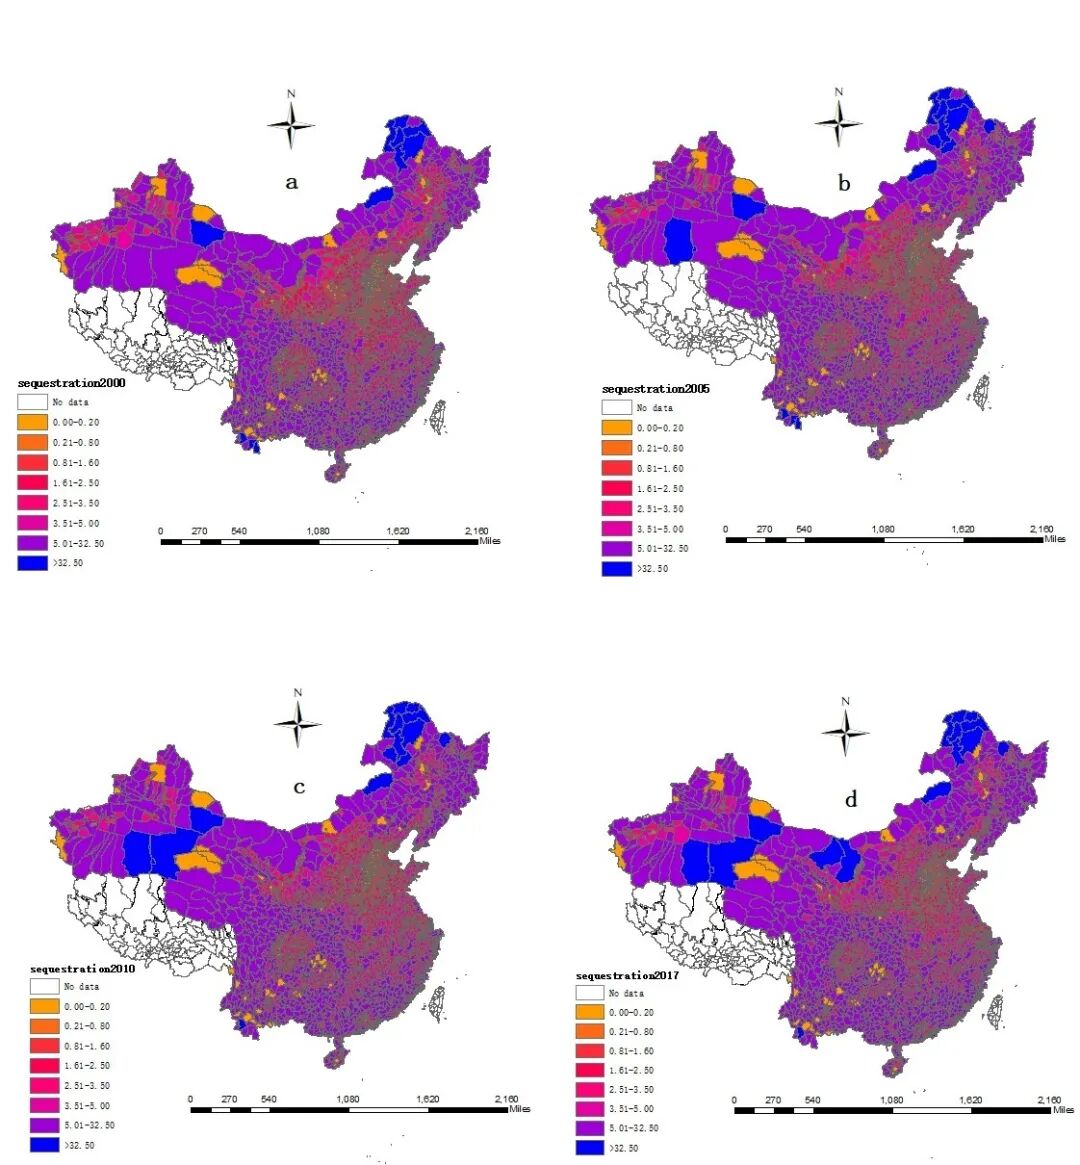
(2) Terrestrial vegetation CO2 sequestration data for 2,735 counties in China from 2001 to 2017
3| Research Methods and Process
First, the study matches DMSP/OLS and NPP/VIIRS data. DMSP/OLS data are among the earliest relative radiance nighttime light data sources, covering the period from 1992 to 2013. Since 2012, NGDC has provided NPP/VIIRS radiometrically calibrated data with higher spatial resolution. Although the two nighttime light datasets together cover a long time span, differences in sensors, resolution, and measurement functions create a large gap in data scales. This difference causes a discontinuity in nighttime light data after 2013, so most studies using nighttime light data can only limit their research periods to before 2013 or after 2013.
Therefore, the study uses the particle swarm optimization back-propagation (PSO-BP) algorithm to match and harmonize DMSP/OLS and NPP/VIIRS satellite data, achieving what may be the best fit to date. The specific training and testing results are shown in Figures 3 and 4. The study then uses the PSO-BP algorithm to construct the relationship between nighttime light data for Chinese provinces and cities and fossil energy consumption CO2 emissions data for provinces and cities, reaching a fitting performance of 0.998. Based on a top-down approach, the study then uses total county light brightness as the weighting factor to estimate fossil energy consumption CO2 emissions for Chinese counties. At the same time, considering the significant potential and capacity of vegetation to absorb and sequester CO2 emissions, the study uses the MOD17A3H product provided by the MODIS platform to calculate net primary productivity for Chinese counties from 2000 to 2017, and then obtains terrestrial vegetation carbon sequestration through the conversion coefficient between vegetation dry matter and absorbed CO2.
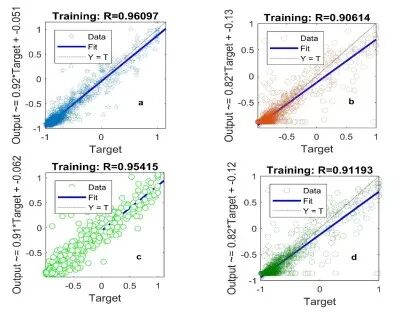
Figure 3. Training results for the average pixel values of DMSP/OLS and NPP/VIIRS images in 2013.
(a) shows the results based on the PSO-BP algorithm with additional input parameters; (b) shows the results based on the PSO-BP algorithm without additional input parameters; (c) shows the results based on the BP algorithm with additional input parameters; and (d) shows the results based on the BP algorithm without additional input parameters.
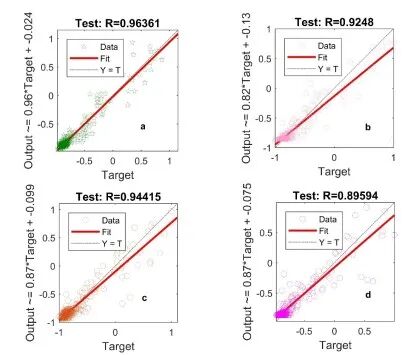
Figure 4. Testing results for the average pixel values of DMSP/OLS and NPP/VIIRS images in 2013.
(a) shows the results based on the PSO-BP algorithm with additional input parameters; (b) shows the results based on the PSO-BP algorithm without additional input parameters; (c) shows the results based on the BP algorithm with additional input parameters; and (d) shows the results based on the BP algorithm without additional input parameters.
Data and article citation: Chen, J., Gao, M., Cheng, S. Hou, W., Song, M., Liu, X., Liu, Y.*, & Shan, Y.*. County-level CO2 emissions and sequestration in China during 1997-2017. Sci Data7, 391 (2020).