CEADs Data: A 2015 Inventory of Embodied Carbon Emissions for Chinese Power Transmission Infrastructure Projects
Research Background
China's electricity production centers and consumption centers are distributed in opposite directions, prompting large-scale construction of power transmission infrastructure. From 1990 to 2015, the total length of China's transmission lines of 220 kV and above grew rapidly from 84,300 kilometers to 683,000 kilometers, making China the country with the largest power transmission infrastructure in the world. In recent years, with the development of ultra-high-voltage power grids and the proposal of the global energy interconnection strategy, a new wave of power transmission infrastructure construction is expected worldwide.
The construction of power transmission infrastructure consumes fossil fuels such as gasoline and diesel, directly generating carbon emissions. It also indirectly causes substantial carbon emissions through the use of high-emission-intensity building materials, such as cement and steel, and electrical equipment, such as cables, transformers, and line fittings. However, existing studies lack in-depth discussion of China's power transmission infrastructure, leaving blind spots in the understanding of its environmental impacts and emissions inventories. This is not conducive to achieving energy conservation and emissions reduction goals in the power system.
To address these issues, the CEADs team, including Wendong Wei from Shanghai Jiao Tong University and Jiashuo Li from Shandong University, together with experts and scholars from the University of Shanghai for Science and Technology, Peking University, Tsinghua University, East China University of Science and Technology, and other academic institutions in China, developed a 2015 input inventory database for China's power transmission infrastructure based on more than 10,000 input items from 191 typical power transmission infrastructure projects. On this basis, this study used input-output tables from the EXIOBASE database to calculate the embodied carbon emissions generated during the construction of power transmission infrastructure, and conducted a detailed uncertainty analysis of the carbon emissions of each typical project based on Monte Carlo simulations. The results were recently published in Scientific Data.
Data Introduction
The inventory includes four datasets:
(1) One table showing the correspondence among raw product input data, primary product classifications, and EXIOBASE input-output sectors.
(2) 191 inventory tables for typical power transmission infrastructure projects, including 145 typical AC transmission line projects, 37 typical AC substation projects, 8 typical DC transmission line projects, and 1 typical DC converter station project, covering their inputs and embodied carbon emissions.
(3) One summary table of embodied carbon emissions for typical transmission line projects.
(4) One summary table of embodied carbon emissions for typical substation and converter station projects.
Research Results
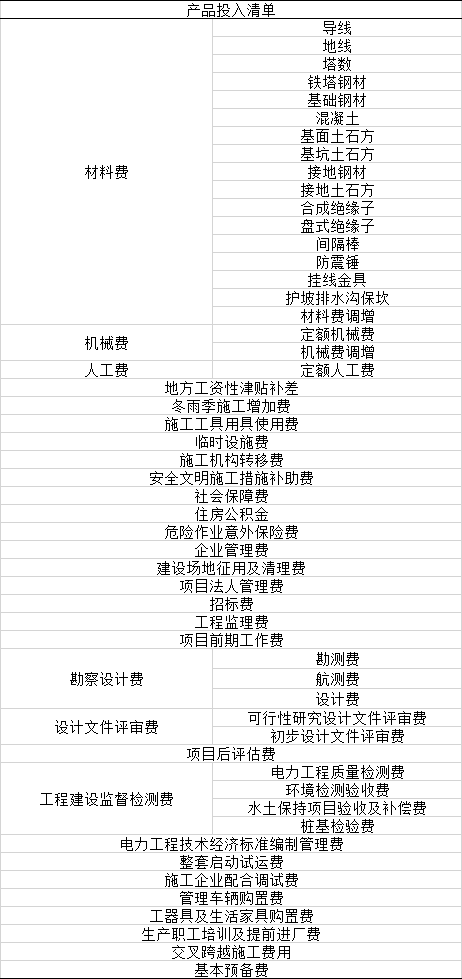
The input inventories of typical transmission line, substation, and converter station projects were sourced from the State Grid Corporation of China. The typical schemes include AC transmission lines and substations at five voltage levels, 220 kV, 330 kV, 500 kV, 750 kV, and 1000 kV, as well as DC transmission lines and converter stations at ±800 kV. Within each voltage level, typical transmission line projects also differ in product inputs because of terrain differences, including plains, hills, mountains, high mountains, deserts, and river marshes. The input items of typical transmission line project 2AG are shown in the table below:
Table 1 Input inventory of typical transmission line project 2AG
The results show that, among typical transmission line projects, carbon emissions increase with voltage level and the number of circuits. The projects 10GB4S, 10GB3H, and 10GB4Q have the highest carbon emissions. Similar characteristics are observed in typical substation projects, where substations with higher voltage levels lead to higher carbon emissions. Among all typical substation projects, 10A-2, 10B-1, and 7A-1 have the largest carbon emissions. Compared with substations, an 800 kV DC converter station generates more carbon emissions, 2.7 times those of substation 10A-2. This is because the main structure of a converter station includes a valve hall, converter transformers, AC switchyard, smoothing reactors, filters, reactive power compensation equipment, and many other carbon-intensive products.
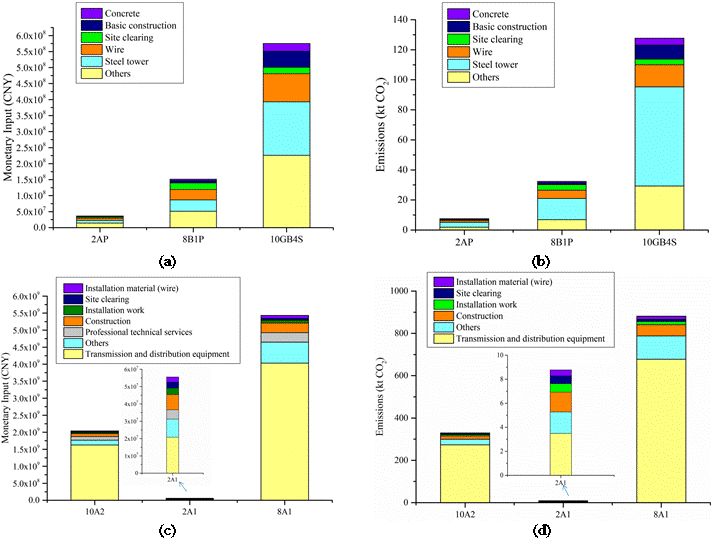
(a: inputs of transmission line projects 2AP, 8B1P, and 10GB4S; b: carbon emissions of transmission line projects 2AP, 8B1P, and 10GB4S; c: inputs of substation projects 2A1 and 10A2 and converter station project 8A1; d: carbon emissions of substation projects 2A1 and 10A2 and converter station project 8A1)
The input shares of each typical project show different characteristics. The study selected the substation project with the lowest emissions, 2A1; the substation project with the highest emissions, 10A2; the transmission line project with the lowest emissions, 2AP; the transmission line project with the highest emissions, 10GB4S; and the 800 kV converter station for analysis (Figure 1). In typical project 2A1, electrical equipment, namely transmission and distribution equipment, accounts for the highest shares of both inputs and emissions, representing 37.32% of the project budget and 39.74% of total emissions. The construction sector follows. Unlike electrical equipment and construction, the service sector has a lower embodied emission intensity, with professional technical services accounting for only 2.01% of total project carbon emissions and 9.68% of the budget. As voltage level increases, the budget shares of construction and installation gradually decline, while the budget share of electrical equipment gradually increases. In typical project 10A2, the budget share and emissions share of electrical equipment, namely transmission and distribution equipment, are 79.67% and 82.80%, respectively. The budget and emissions structure of the converter station is similar to that of typical project 10A-2. Equipment inputs, namely transmission and distribution equipment, account for the vast majority of both budget and emissions, at 74.18% and 76.90%, respectively. Construction accounts for 6.03% of emissions and 5.21% of the budget, making it the second-largest emitting sector. From the perspective of substation projects, the input budget and emissions structures of 2AP and 10GB4 are very similar.
Summary
This database provides a solid data foundation for future research on the evolution of carbon emissions from China's power transmission infrastructure, and helps assess the carbon emission structures of power transmission infrastructure in different regions of China and optimize infrastructure planning and design. In addition, the methodological framework of this study can also be applied to carbon emission accounting for infrastructure such as road transportation and electronic communications. Incorporating carbon emissions into feasibility assessments for infrastructure construction is conducive to greener and lower-carbon construction processes.
Original Article
Wei, W., Wang, M., Zhang, P. et al. A 2015 inventory of embodied carbon emissions for Chinese power transmission infrastructure projects. Sci Data 7, 318 (2020).