CEADs Releases: The World's First Near-Real-Time Carbon Emissions Map
This study proposes a spatial representation framework for carbon emissions based on a near-real-time carbon emissions quantification method and a parametric model, built on a cloud computing platform that couples satellite remote sensing data, ground monitoring data, statistical data, and other multi-source inputs. It delivers global carbon emissions mapping with high spatiotemporal precision (daily scale, 0.1-degree grid) and high timeliness (near-real-time updates with only about one month of lag), and builds the world's first near-real-time daily carbon emissions map - Global Gridded Daily CO2 Emissions Dataset (GRACED) - starting from January 1, 2019, providing important data support for global carbon emissions monitoring and policy evaluation.
Research Background
Global climate change is a severe challenge to sustainable human development. Carbon data are the basis for climate-change research and related policy making. As an important tool for visualizing the path to carbon neutrality and a key indicator for assessing national peaking progress, they have attracted widespread international attention. Beyond the scale of emissions, we also need to know their sources, how they change, and where they may be headed. Carbon emissions maps provide key geographic information and are core data in climate-change research.
However, current carbon emissions maps are constrained by technical limits and can only display historical data on an annual basis, making it difficult to reflect dynamic spatiotemporal evolution. Global emissions reduction and carbon neutrality goals depend on timely, accurate, and reliable dynamic monitoring and policy evaluation, which makes a new spatiotemporal carbon-emissions representation paradigm urgently needed.
Achieving near-real-time, high-resolution spatiotemporal representation requires fine-grained quantification of emission sources and dynamic capture of emission changes. In recent years, multi-source and multi-dimensional data from satellite remote sensing and sensors, together with the computing power of cloud platforms, have created the conditions to solve these challenges.
Research Results
Against this backdrop, the CEADs team, led by Associate Professor Zhu Liu's group in the Department of Earth System Science at Tsinghua University and collaborating with multiple research institutions at home and abroad, proposed a spatial representation framework for carbon emissions based on a near-real-time carbon emissions quantification method and a parametric model.
The study breaks through current data and technical bottlenecks in the field. By parameterizing and decomposing activity factors in carbon-emissions accounting, and using ground observations, satellite remote sensing data, and grid-monitoring data to invert the spatiotemporal variation of parameter data, the team built an algorithm-based theoretical and methodological model for daily global near-real-time carbon accounting. It then relied on cloud computing platforms to automate the processing and assimilation of multi-dimensional data sources and multiple observation methods. Based on the spatial distribution of global power plants, major factories, road networks at all levels, household consumption, flight routes, and shipping lanes, the team built a model framework that enables near-real-time, fast grid-level carbon-emissions calculation across sectors and globally, further improving the spatiotemporal resolution of global carbon data and creating the first global near-real-time daily carbon emissions map, GRACED.
GRACED enables near-real-time updates to carbon emissions maps, moving the spatiotemporal study of global carbon emissions from the past tense to the present tense. It records daily changes in global carbon emissions since January 1, 2019, and is currently the only global near-real-time carbon emissions map with daily resolution and sectoral breakdowns. The dataset includes high-resolution activity data covering more than 70% of global power and industrial emissions, 85% of ground-transport emissions, and nearly 100% of residential and aviation fuel emissions, covering more than 90% of global carbon dioxide emissions. It spans the seven major global CO2-emitting sectors shown in Figure 2: power, industry, residential consumption, ground transport, domestic aviation, international aviation, and international shipping. GRACED shows the types, sources, and spatiotemporal distribution of different emission sources, enabling decision-makers and researchers to track and quantify emission sources throughout the process according to regional resource allocation and industrial development, thereby providing basic data support for analyzing regional environmental governance synergies and policy recommendations.
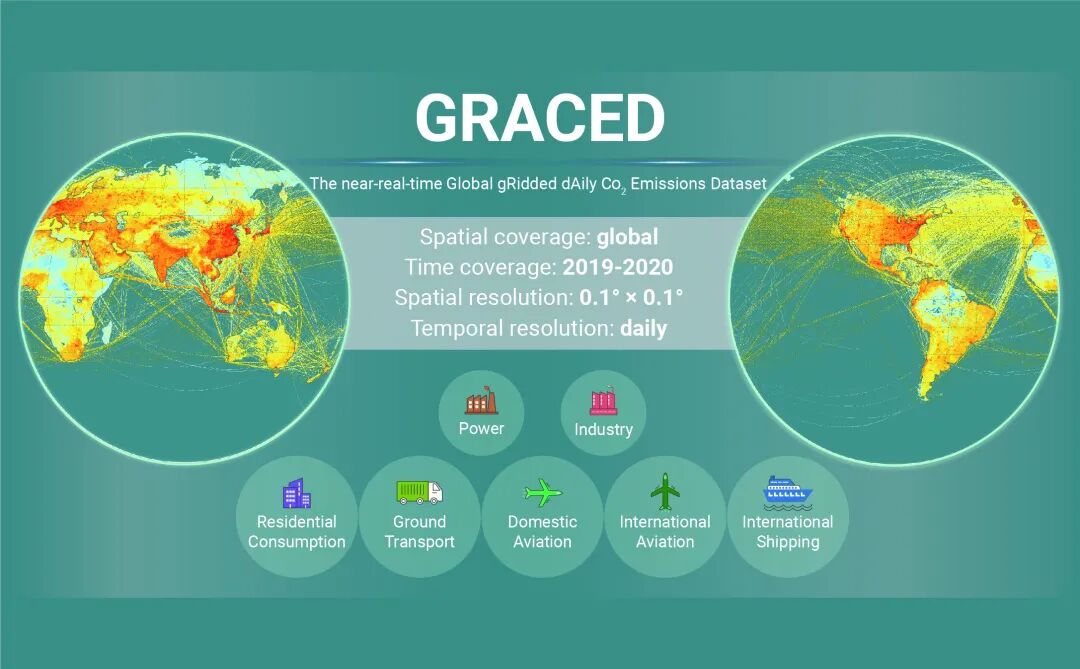
Figure 2. GRACED Dataset Summary
GRACED reflects the spatiotemporal dynamics of carbon emissions caused by changes in human activity, including the real-time effects of climate, seasons, holidays, and even the COVID-19 pandemic on emissions (Figure 3; the redder the color, the higher the emissions, and the bluer the color, the lower the emissions).
Figure 3 shows the real-time dynamic changes in carbon emissions across four major global emission regions (A. East Asia, B. the contiguous United States, C. Europe, and D. South Asia).
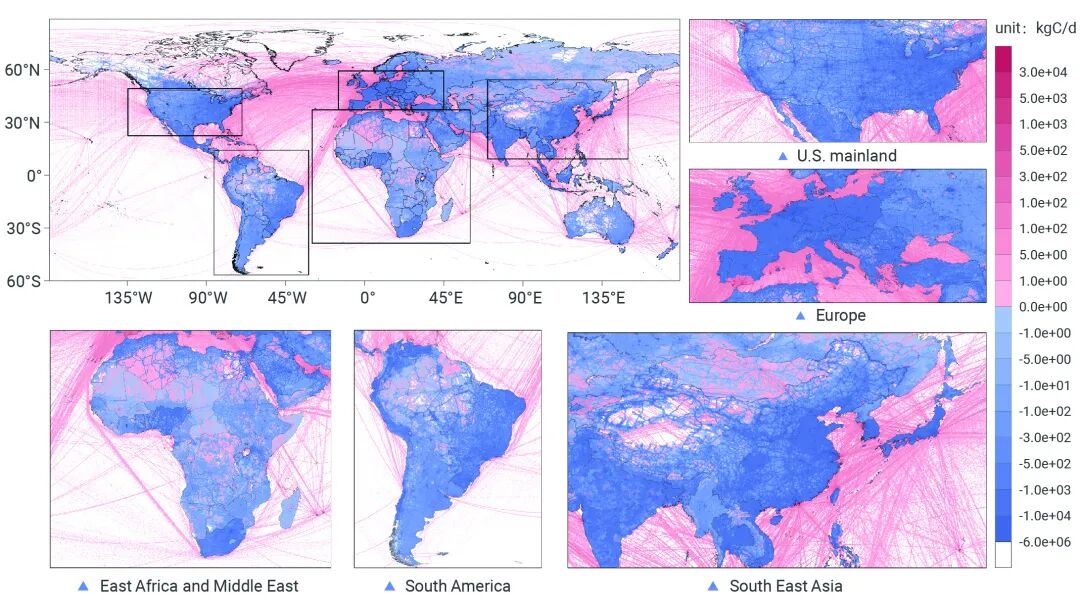
GRACED also captures the real-time effects of weekends and weekdays on emissions (Figure 4; the deeper the red, the higher weekend emissions are relative to weekdays, and the deeper the blue, the lower they are). The data show that weekend emissions are lower than weekday emissions in most regions worldwide. The difference between weekday and weekend emissions is more pronounced in developed regions than in less developed regions, as shown by the dark blue areas in Figure 4. This pattern closely matches the linear characteristics of ground-transport emissions, indicating that reduced travel activity on weekends has an important effect on lowering weekend carbon emissions. Compared with 2019, the difference between weekend and weekday emissions in 2020 was smaller, mainly because remote work policies during the pandemic substantially reduced weekday commuting, making the difference between weekend and weekday emissions less significant in 2020.
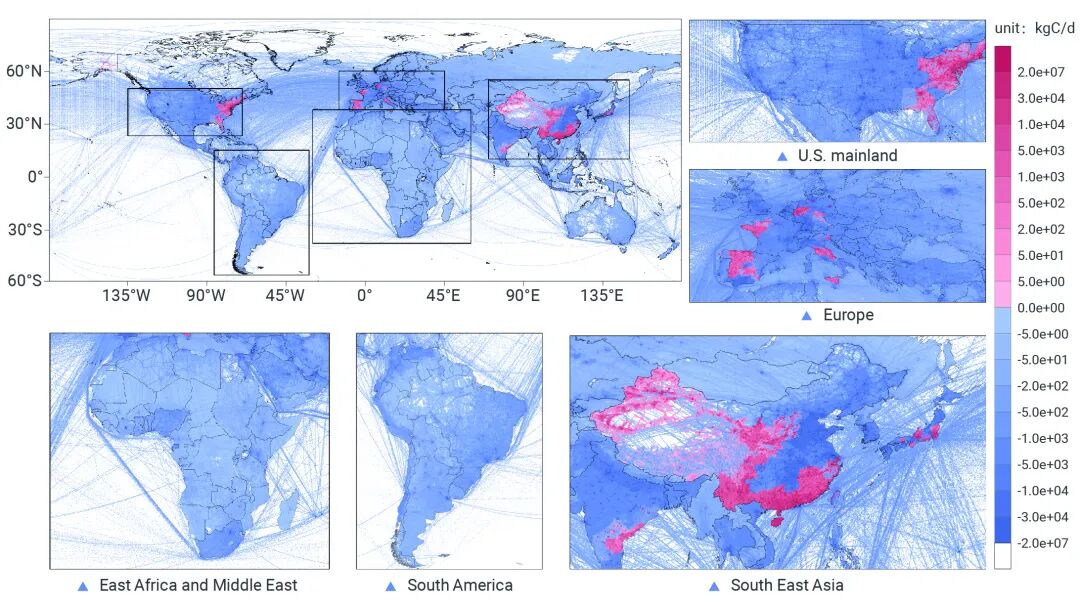
GRACED reflects the real-time impact of COVID-19 on carbon emissions. Compared with 2019, global total emissions generally declined in 2020 (blue areas in Figure 5). However, a small number of regions saw increases (red areas in Figure 5), including eastern United States, the United Kingdom, parts of southeastern India, some prefectures in Japan, and central and western China. The main reasons were differences in epidemic-control intensity, post-epidemic recovery, and timing across regions. In China, for example, industrial activity declined briefly in the early stage of the pandemic, causing a temporary drop in emissions. But because of strict and effective control measures, industrial activity gradually recovered later, and the rebound in emissions from economic recovery partly offset the early reduction caused by the pandemic.
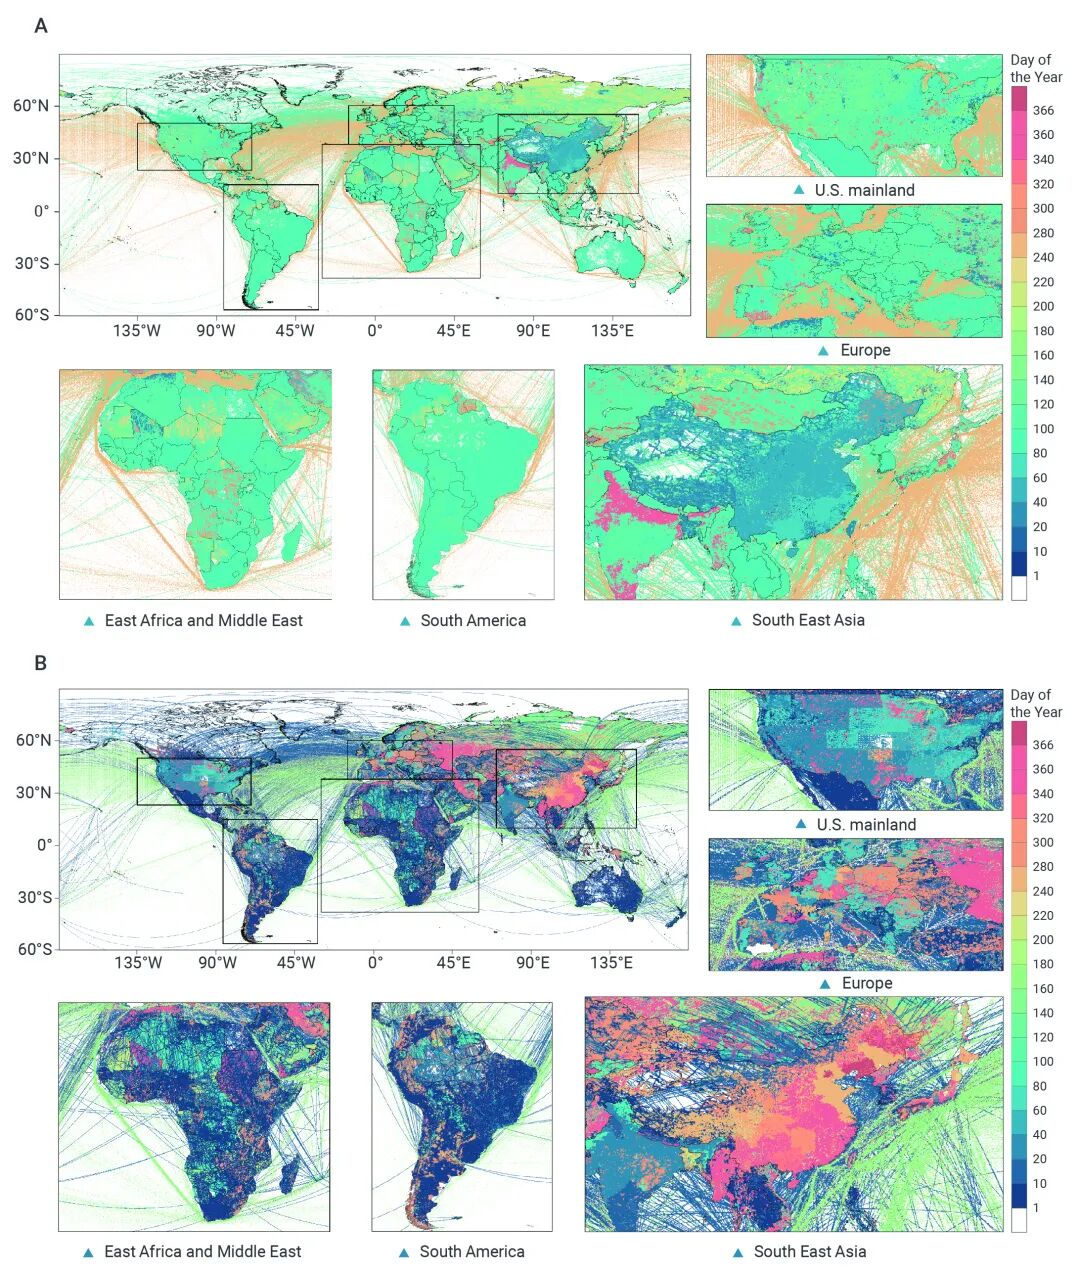
GRACED also reveals differences in when various global regions experienced large emission declines from the pandemic and when later economic recovery caused notable rebounds (Figure 6). Figure 6A shows the carbon map on the day of the maximum emission decline across regions, while Figure 6B shows the map on the day of the maximum rebound. Redder colors indicate later dates.
The maximum-decline map shows that international aviation and international shipping were the first to be hit by COVID-19 (the dark blue routes in Figure 6A), mainly because countries imposed strict restrictions on cross-border transport during the pandemic. From a country perspective, China reached its maximum decline earlier than others (shown in dark blue in Figure 6A), closely tied to China's early exposure to the pandemic. Other countries reached their maximum decline later, mainly because they were hit by the first wave later or experienced a stronger second wave. On the maximum-rebound map, some Indian states, parts of the United States, and European countries such as Spain rebounded earlier, mainly because different regions have different industrial structures and levels of pandemic impact, and some regions inevitably recovered better than others.
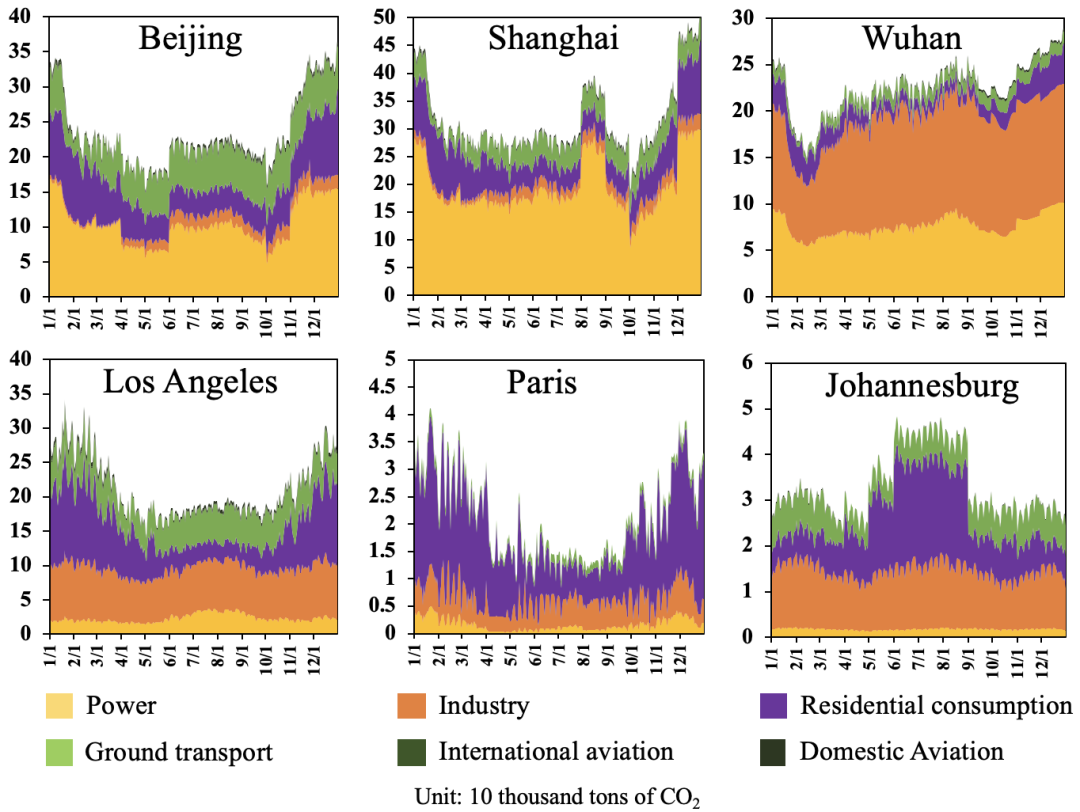
GRACED covers key emission regions, including major cities around the world, and quantifies the spatiotemporal dynamics of sectoral emissions. The data show that in 2020, carbon emissions in Beijing, Shanghai, and Wuhan were first affected by the pandemic in late January and fell sharply, but then stabilized after the outbreak was brought under control. In Los Angeles, Paris, and Johannesburg, the impact came later, with significant emission declines only in April and May (Figure 7).
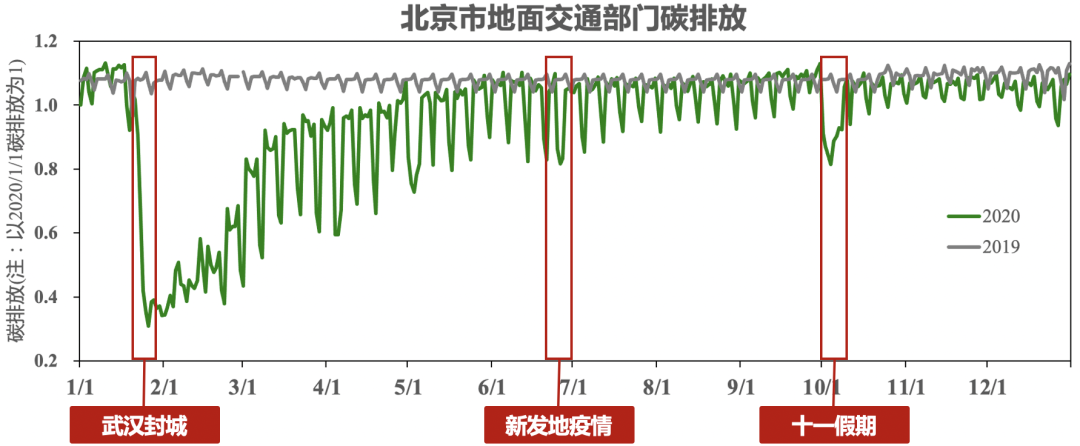
GRACED can precisely capture sectoral emission dynamics under the influence of the pandemic, holidays, and other factors at fine spatial scales such as cities. Taking Beijing as an example, GRACED precisely captured a significant drop in ground-transport emissions in Beijing at the end of January 2020 due to the pandemic; another decline in late June 2020 due to the Xinfadi outbreak; and a clear decline in early October 2020 as residents traveled during the National Day holiday (Figure 8).
Conclusion and Outlook
This study proposes a spatial representation framework for carbon emissions based on a near-real-time carbon emissions quantification method and a parametric model, and constructs the near-real-time daily carbon emissions map GRACED, providing important data support for global dynamic monitoring of carbon emissions and policy evaluation. The dataset has already been widely adopted internationally, including in the WMO Scientific Advisory Group 2021 report, the Global Carbon Project's 2021 Global Carbon Budget annual report, and UNEP's Emissions Gap Report 2021. The near-real-time global carbon map will support countries and regions in carrying out targeted carbon-emissions assessments and help adjust climate policy measures in time, thereby enabling a more scientific and precise realization of carbon-neutrality goals.