CEADs Releases the 2001-2019 Carbon Emission Accounting Inventory for Chinese Prefecture-Level Cities and an Analysis of Urban Carbon Peaking Trends
Research Background
Research on Urban Carbon Emissions
Low-carbon development is an inevitable choice in the context of global climate change. It is also a major strategic opportunity for promoting high-quality economic development in China and for contributing to global climate governance. In September 2020, the Chinese government announced that it would enhance its nationally determined contributions and adopt stronger policies and measures, striving to peak carbon emissions before 2030 and achieve carbon neutrality before 2060. China plays an important role in global climate-change mitigation. Research on city-level carbon emission trends and peaking patterns can support the delivery of China carbon peaking target and the implementation of low-carbon transition pathways.
Recently, the CEADs team, led by Associate Professor Yuli Shan team at the University of Birmingham, compiled and freely released a long time-series carbon emission inventory for Chinese prefecture-level and above cities from 2001 to 2019 (https://ceads.net/data/city/). Associate Professor Yuli Shan team also published a study titled City-level emission peak and drivers in China, which examines the carbon peaking status and driving forces of urban emissions. The study was published in Science Bulletin, jointly sponsored by the Chinese Academy of Sciences and the National Natural Science Foundation of China.
Research Content
Method Overview
For this release, the CEADs team compiled carbon dioxide emission inventories for 287 Chinese prefecture-level and above cities from 2001 to 2019. The study area covers more than 98% of China population, more than 99% of GDP, and more than 97% of CO2 emissions. The city emission inventories are consistent with the national and provincial emission accounts previously released by CEADs in terms of accounting methods, scope, and data sources, enabling cross-scale comparison. The inventory covers 47 socioeconomic sectors and emissions related to the combustion of 17 types of fossil fuels and cement production. It uses the carbon dioxide emission accounting method recommended by the Intergovernmental Panel on Climate Change (IPCC), and covers all direct carbon emissions caused by human socioeconomic activities within city administrative boundaries.
Starting from long time-series emission data, the study identified the peaking status of cities based on a multi-condition function, the Mann-Kendall (MK) trend test, and the decoupling relationship between carbon emissions and social development indicators, namely economic development level and population size. The study further used index decomposition analysis to quantify the contributions of key drivers to the decline in urban emissions. Finally, the paper provides policy recommendations for different cities to reach emission peaks and carbon neutrality.
Research Findings
Heterogeneity in Urban Emission Patterns
The results show that the 287 Chinese prefecture-level and above cities differ significantly in energy and economic structures, emission patterns, and carbon peaking status, as shown in Figure 1. In 2014, the top ten emitting cities contributed 18.2% of total emissions, accounted for 8.5% of the total population, and generated 15.3% of GDP, while the bottom 50% of cities contributed only 19.0% of total emissions, accounted for 41.5% of the total population, and generated 24.7% of GDP. The top ten emitting cities are mainly megacities with large economies and high consumption levels, such as Shanghai and Nanjing in Jiangsu, or energy-intensive manufacturing cities, such as Tangshan in Hebei and Yulin in Shaanxi. Lower-ranking cities, such as Huangshan in Anhui and Ganzi in Sichuan, have relatively small economies and lower levels of industrialization.
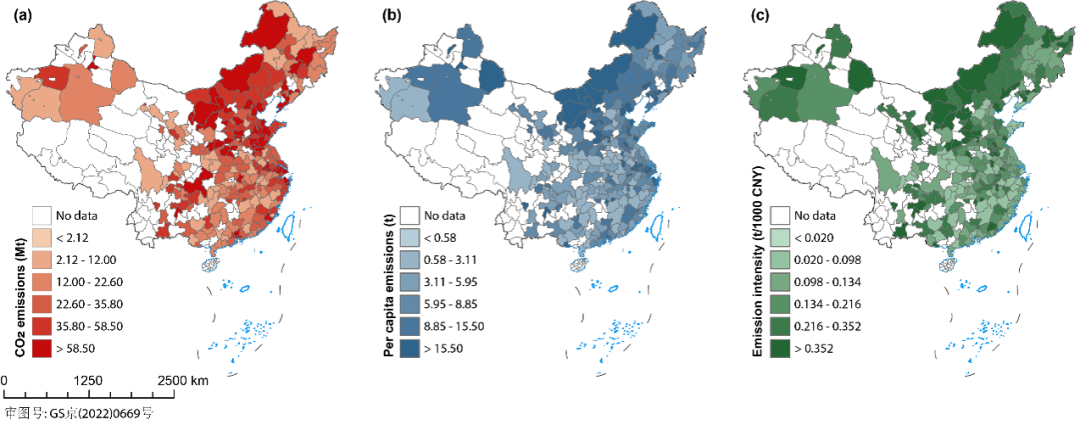
a) Total carbon dioxide emissions (million tonnes). b) Per capita carbon emissions (tonnes). c) Emission intensity (tonnes per thousand yuan, constant 2010 prices).
Urban Peaking Trends
By 2019, 38 Chinese prefecture-level and above cities had achieved active carbon emission peaking, meaning emissions had shown a significant downward trend for more than five consecutive years while economic or population growth remained stable. These are referred to as active-peaking cities. Another 21 prefecture-level and above cities had experienced passive declines in carbon emissions, meaning carbon emissions continued to fall but were not decoupled from economic or population development. These are referred to as passive-decline cities. Twenty prefecture-level and above cities were on an emission plateau, with carbon emissions declining for more than five years but potentially showing rebound trends. These are referred to as plateau cities. Another 139 prefecture-level and above cities remained in the climbing phase, with emissions continuing to rise or short-term declines lasting less than five years. These are referred to as cities that have not yet peaked.
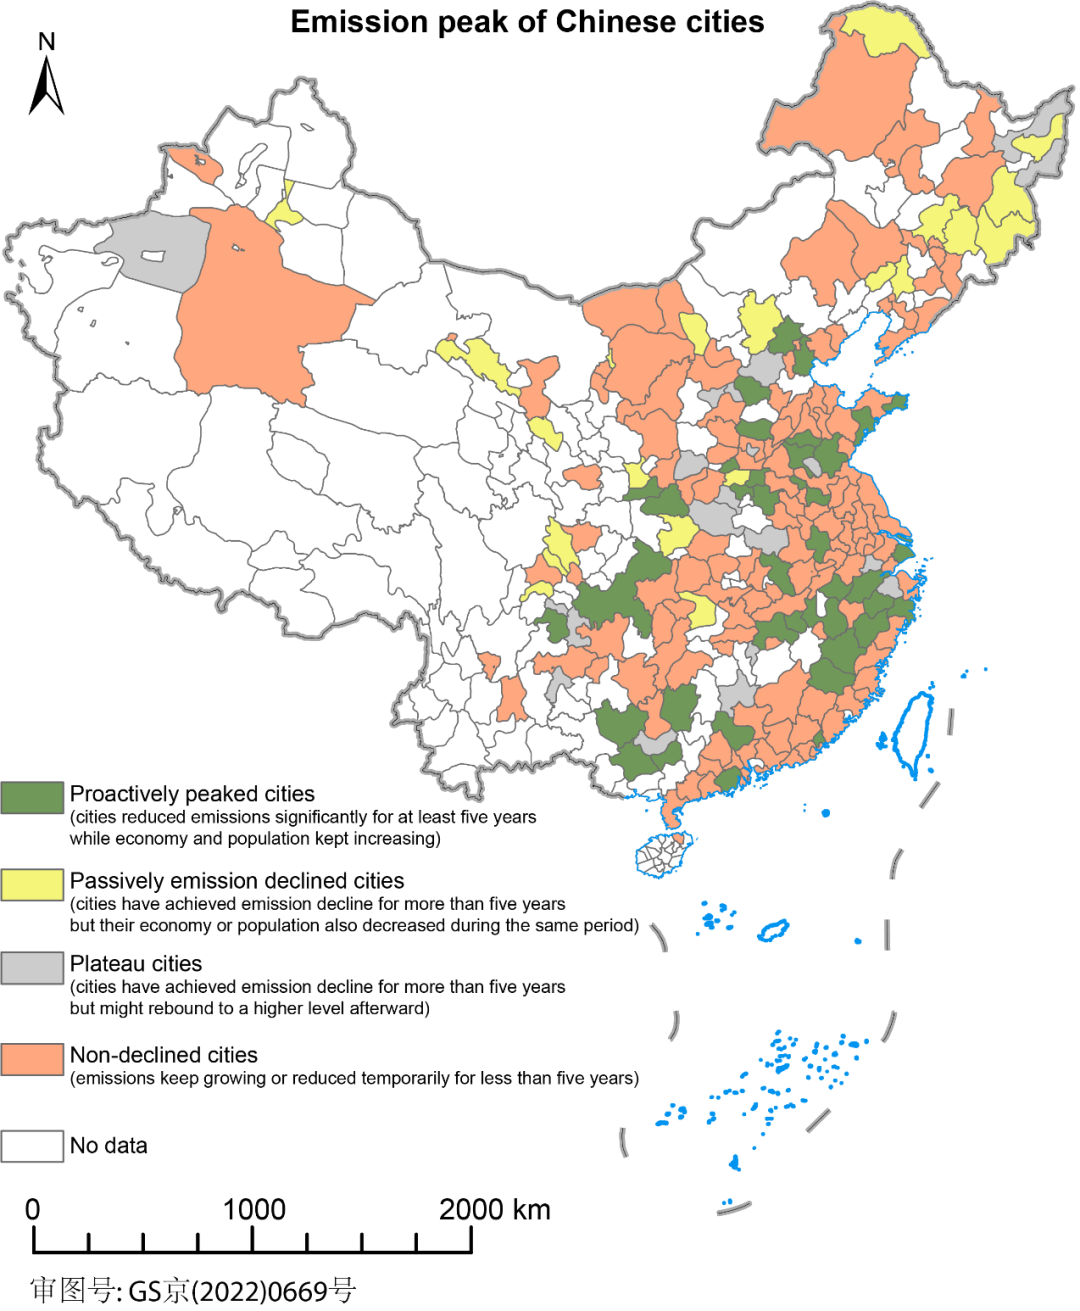
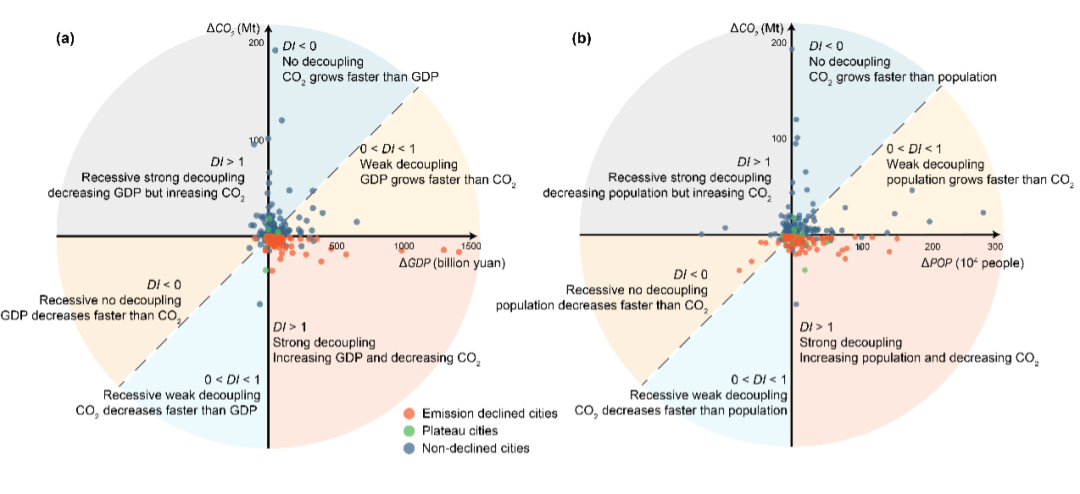
Figure 3. Decoupling between carbon dioxide emissions and economic development level (a) and population size (b) in Chinese prefecture-level and above cities.
Driver Analysis
The causes of declining urban carbon emissions vary across cities. The driver analysis shows that the main drivers of emission reductions in the 38 active-peaking cities were improvements in energy-use efficiency and optimization of the energy structure. These actively peaked cities decoupled economic and population growth from emissions, meaning emissions declined while the economy and population continued to grow. In contrast, emission reductions in the 21 passive-decline cities were partly caused by economic recession or population loss, and their emissions were not decoupled from economic level or population. The study analyzed the peaking status of representative cities and provides policy recommendations for different cities to reach emission peaks and carbon neutrality.
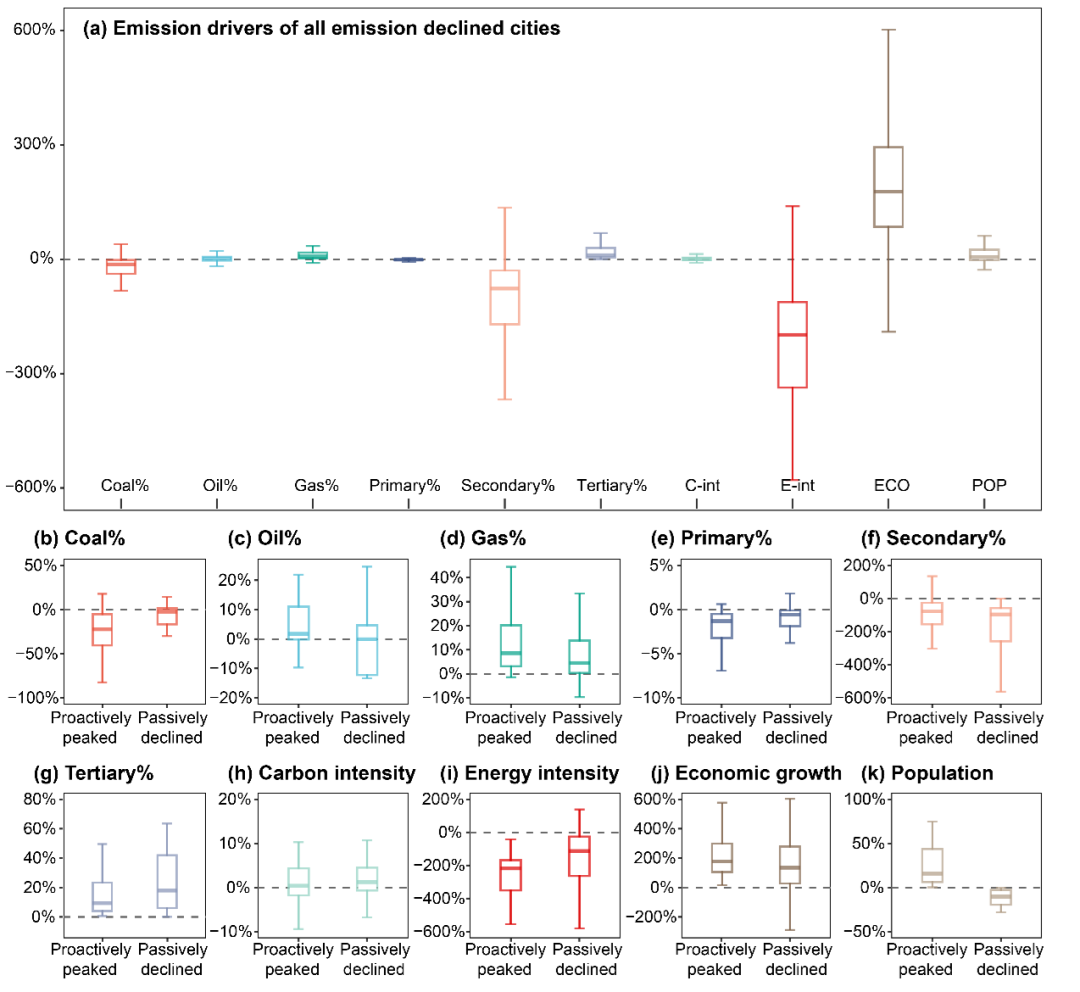
a) Contributions of drivers in all cities with declining emissions. b-k) Differences in drivers between active carbon-peaking cities and passive-decline cities.
Research Conclusions
Policy Recommendations
As industrialization and urbanization continue, carbon peaking is an inevitable process. Different types of cities follow different peaking pathways and need policies tailored to their own conditions. This study supports the delivery of carbon emission peaking targets and the implementation of low-carbon transition pathways for different types of cities. The study argues that urban emission reduction targets should not adopt a one-size-fits-all policy. Instead, they should comprehensively consider factors such as urban resource endowments, level of industrialization, socioeconomic characteristics, and development goals.
The experience and lessons of active-peaking cities can inform other cities. Super-emitting cities with outdated technology and low production efficiency should set larger emission reduction targets and stricter supporting policies in the future, thereby creating more room for economic development in less developed regions. Passive-decline cities should face the drivers behind declining emissions, seize the new opportunities for industrial innovation and green investment created by the dual-carbon goals, and pursue the dual tasks of economic recovery and carbon reduction so as to fully decouple carbon reduction from economic development. Active-peaking cities should further explore strategies and policy support for sustained carbon emission reductions, contribute to the national goal of peaking carbon emissions before 2030, provide emission reduction space for phased regional carbon peaking, and offer low-carbon development experience for cities that have not yet peaked.
This article was led by Associate Professor Yuli Shan of the University of Birmingham, with Professor Dabo Guan of Tsinghua University as the corresponding author. Doctoral student Yuru Guan of the University of Groningen, Professor Klaus Hubacek, and other scholars also contributed.
Paper download link:
https://www.sciencedirect.com/science/article/pii/S2095927322003838
Data download link:
Latest carbon emission inventory for Chinese prefecture-level and above cities: https://ceads.net/data/city/
For questions about the city inventories and the paper, please contact the CEADs team: Yuli Shan, shanyuli@outlook.com, Dabo Guan, guandabo@hotmail.com
Citation:
Yuli Shan et al. (2022). City-level emission peak and drivers in China. Science Bulletin.