CEADs Release: EMERGING Model - Full-Scale Near Real-Time Global Input-Output Tables
Model Background
Multi-Regional Input-Output Model
Multi-regional input-output (MRIO) models reveal the economic and technical links among sectors in different regions, and have proven effective for describing and analyzing supply chains and the linkage effects between consumption and production sectors. In recent years, they have been widely applied in economic, environmental, social, and related fields. As economies continue to develop, emerging economies are playing an increasingly important role in reshaping international trade patterns and global economic supply chains. However, due to difficulties in data collection and limited data availability, existing MRIO databases do not provide detailed data for emerging economies and sectors. This limits the ability of MRIO models to analyze historical patterns in supply chains and international trade and to forecast future trends.
To address these issues, the CEADs team published the study “Full-scale, near real-time multi-regional input-output table for the global emerging economies (EMERGING)” online in the Journal of Industrial Ecology. Based on multi-source data integration, the study developed a modular compilation framework for a global, full-region input-output model that can be updated in near real time. Using this framework, we compiled the world’s first full-region input-output tables for emerging economies, covering 245 economies and 135 sectors globally (EMERGING). The EMERGING model breaks the dominance of existing MRIO models by Western countries. It is the first near-real-time input-output model independently developed by Chinese scholars, with independent intellectual property rights, for global emerging economies at full economy scale.
At present, EMERGING data for 2010 and 2015-2019 have been released free of charge on the CEADs website (https://www.ceads.net/). In the future, we will update the EMERGING database annually and correct unreasonable data identified through feedback from the field.
Model Overview
Compilation Process
The compilation process of the EMERGING model consists of nine modules (as shown in Figure 1), with corresponding procedures adopted according to data sources and economies. The process involves three main steps: data collection, data compilation, and data validation.
First, we collect bilateral trade data, IO data, sectoral output, GDP, and other data for each economy (data module). To update data for specific economies independently and promptly, the raw data collected for each economy must be stored in Database 1. If newly released economic data are collected that are not yet in Database 1, we update Database 1 and use the update module to revise the existing MRIO tables.
The second step includes the following six modules:
Trade module: National economic data for many emerging economies, such as time-series IO data and sectoral output, are very limited and require substantial labor input. Therefore, we use annually updated bilateral trade data as the core basic data for the compilation process. Through this module, we construct a three-dimensional matrix to establish trade relationships among economies, covering 245 economies and 135 sectors.
Calibration module: To make the fullest possible use of each country’s own statistical data, we collect raw economic data from various sources with different statistical scopes. Because these data are collected from multiple sources, unified macroeconomic data calibration is required to ensure consistency across economies and statistical scopes.
Decomposition module: The trade matrix constructed in the trade module provides bilateral trade flow information on total imports and exports for each product and all economies, which only satisfies the data requirements for compiling national competitive IO tables. In this module, we use bilateral trade data and other economic data to compile national competitive IO tables for each economy, including 135 consistent industries. (1) For economies with complete IO data, we use the decomposition module to compile national competitive IO tables. (2) For economies without complete IO data, we use the compiled national IO tables for the corresponding regions obtained in step (1), apply weighted averaging to obtain approximate regional competitive IO tables, and store them in Database 2 through the regional module. We then combine the regional IO tables constructed in the regional module and compile national competitive IO tables for economies without complete IO data in the decomposition module.
This module is followed by the transformation module. For each economy, the competitive IO table must be transformed into a national non-competitive IO table. Then, we use the linkage module to assemble all national non-competitive IO tables into a complete MRIO table.
As the final step, we validate the compiled 2015 EMERGING MRIO model. In the validation module, we calculate value added from both the production and consumption perspectives. We then compare the results with those from other databases to ensure that the emerging database is open, transparent, comparable, and verifiable.
Because the compilation process is complex, please refer to the article appendix for details on data processing and basic assumptions.
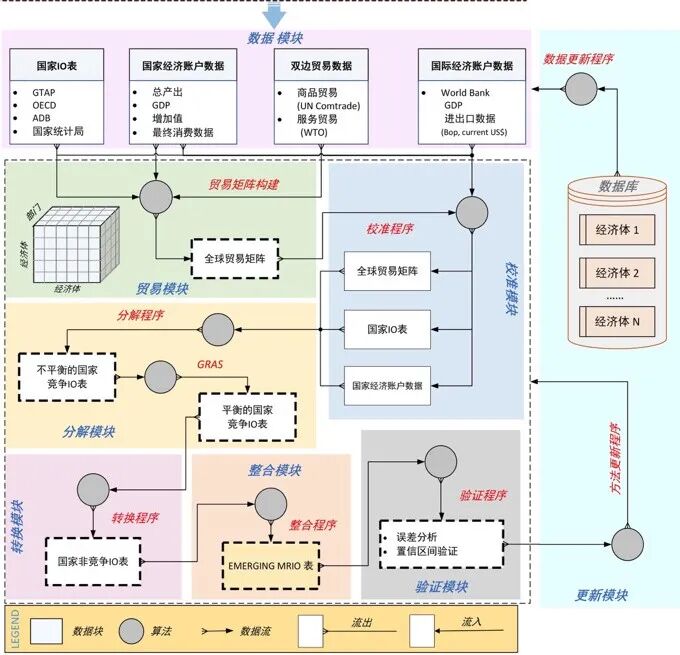
▲ Figure 1: Framework of the EMERGING Model
Model Validation
During validation, we compared value added (VA) from both production and consumption perspectives. The former reflects uncertainty in the original MRIO data, while the latter also incorporates the Leontief inverse matrix. We compared VA for emerging economies in 2015 with results from EXIOBASE 3rx for 2015, OECD for 2015, Eora for 2015, and GTAP 10 for 2014.
(1) Sectoral Validation
For sectoral validation, we first aggregated sectors into 17 common sectors and then selected 12 key disaggregated sectors. Figure 2 shows sectoral comparison results calculated from five MRIO databases.
There are some differences in sectoral distribution across databases, especially in service sectors. The overall sectoral distribution of consumption-based global VA accounts is similar across the five databases. Compared with GTAP 10, Eora, OECD, and EXIOBASE 3rx, the differences in VA results for the 17 aggregated sectors in the EMERGING model are about 0-15%. The largest gap between EMERGING and GTAP appears in service sectors, where the gap in financial services (financial intermediation and business activities) reaches 13.5%. The largest gaps between EMERGING and the other databases (Eora, OECD, and EXIOBASE 3rx) are 6.2%, 6.1%, and 3.7%, respectively. In public sectors (public administration, education, health, entertainment, and other services), the gaps between EMERGING and GTAP and between EMERGING and EXIOBASE 3rx are 7.7% and 3.9%, respectively. Compared with OECD and Eora, the gap is only 0.7%.
For the 12 key sectors, Eora has 26 highly aggregated sectors and OECD has 45 sectors. Therefore, we can only compare EMERGING results for construction, electrical equipment, motor vehicles, and parts with VA results from these two databases. The VA results for construction in EMERGING differ from GTAP 10 (10%), Eora (8%), OECD (22%), and EXIOBASE 3rx (30%) by 8-30%. The largest difference between EMERGING and GTAP is in the mining industry, while the largest gap with EXIOBASE 3rx is in the transportation industry.
The differences among sectors across the five MRIO databases are relatively large, mainly due to differences in the underlying economic data and the degree of sectoral aggregation used by these databases.
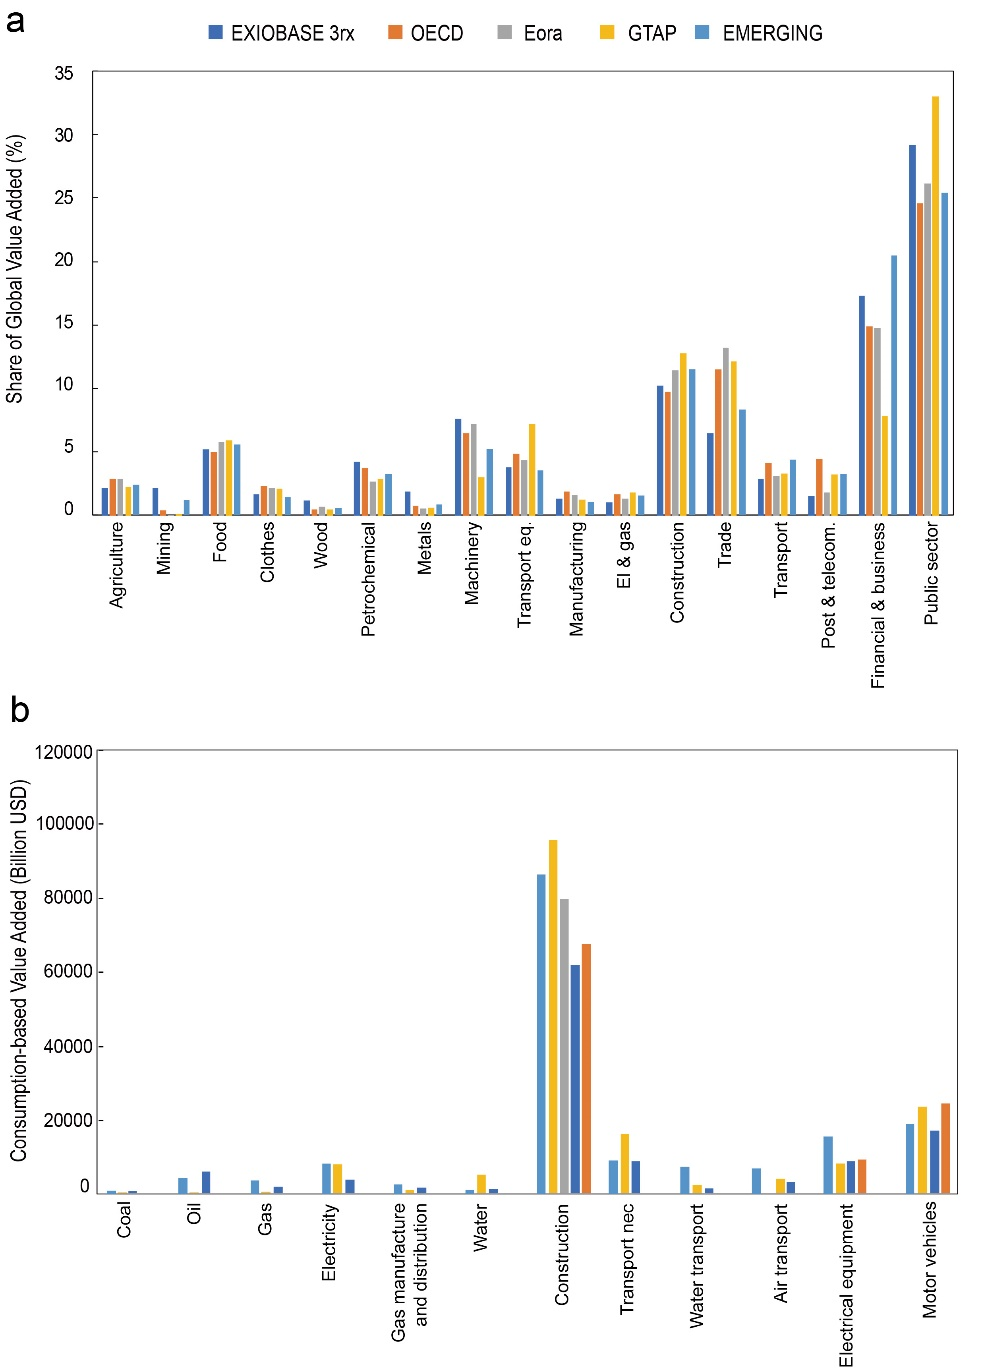
▲ Figure 2: Sectoral Validation Results
(2) Country-Level Validation
We compared VA accounts from the production and consumption perspectives across countries, as shown in Figure 3.
We analyzed results for 63 OECD economies (a, b) and 181 emerging economies (c, d). Differences among existing databases vary by case, so using the maximum difference or average difference is not representative. Therefore, we only compared the minimum differences between the emerging database and the other five databases.
Across OECD economies, the minimum differences in production-based VA range from -20% to 20%. For consumption-based VA, except for Malaysia and Cyprus, the minimum differences for other economies also fall within -20% to 20%. Although trade characteristics (net importer or net exporter) are consistent for each economy across all databases, the benchmark data and compilation methods used by different databases, especially matrices F and L, are different. This leads to large differences in consumption-based VA accounts.
Among emerging economies, the minimum differences for production-based VA range from -60% to 90%, while those for consumption-based VA range from -50% to 90%. Among the five databases, GTAP 10 generally provides higher VA results. Emerging economies show the largest differences across the four databases (EXIOBASE 3rx, OECD, Eora, and GTAP), mainly because different basic data sources are used. Economies that are highly dependent on trade, such as Cyprus, Hong Kong, Malaysia, and Singapore, show the largest differences in consumption-based VA results calculated by the five databases. This is mainly due to differences in how re-export trade is handled and differences in the trade data used by these databases, including UN Comtrade and other data sources.
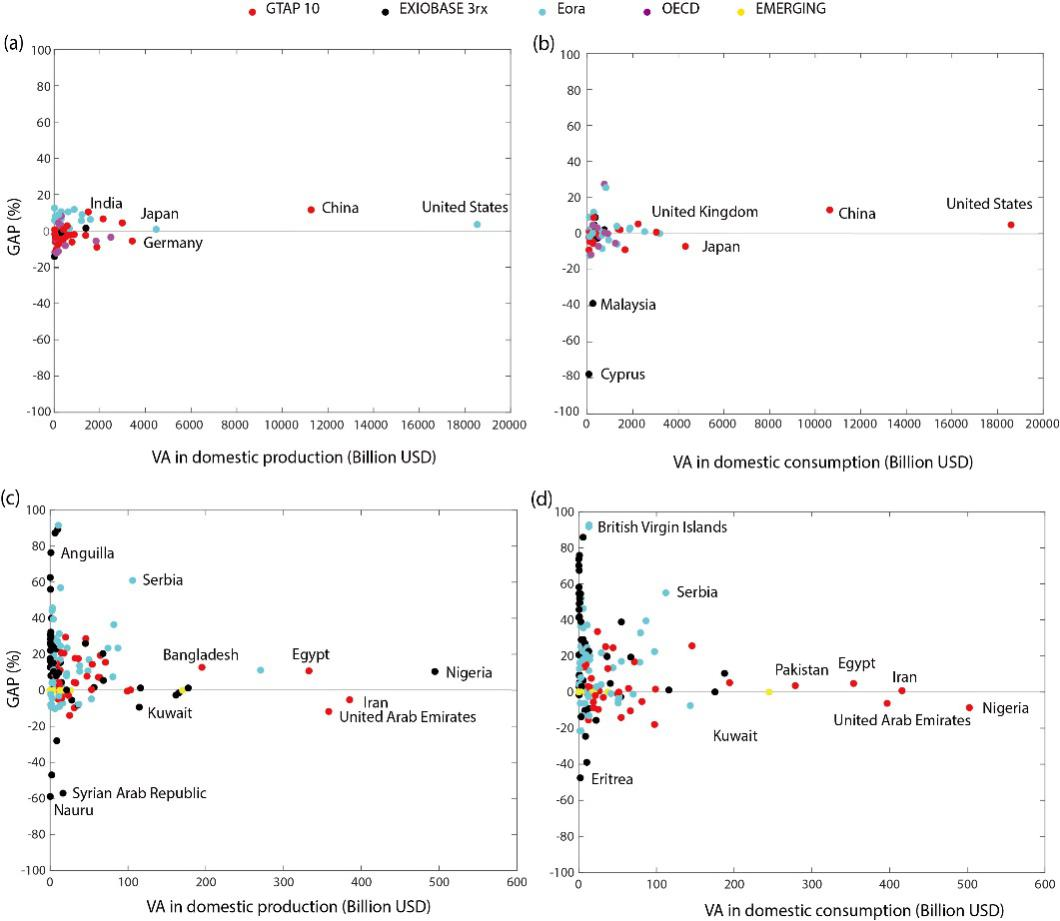
▲ Figure 3: Country-Level Validation Results
Please refer to the full article for details on structural decomposition validation and case analysis.