CEADs Releases Global Country- and Sector-Level Water Use and Water Boundary Exceedance Inventory
01
Research Background
Under globalization, the impacts of consumption behavior have long crossed regional borders. Many countries import water-intensive products to ease domestic water shortages, but in doing so they silently shift water pressure to exporting countries, further intensifying local water stress and threatening the achievement of Sustainable Development Goal (SDG) 6.4, which ensures sustainable freshwater withdrawals and supply to address water scarcity, and SDG 12, which promotes sustainable consumption and production patterns. There is an urgent need to establish a global, high-resolution inventory of water boundary exceedance, meaning the situation in which water use exceeds the sustainable threshold at a given spatiotemporal scale, and to link it precisely to the impacts of final consumption, so that consumption-driven water stress hotspots and their key sectors in global supply chains can be identified and economic spatial layouts can be optimized to safeguard global water security. However, accurately identifying hotspots of water boundary exceedance across multiple spatial scales and tracing them effectively back to final consumption remains a major challenge.
Recently, a global-scale, high-resolution, multi-sector, low-uncertainty model for assessing consumption-side water boundary exceedance was developed under the leadership of Professor Zhao Xu at the Interdisciplinary Institute of Frontier Science, Weihai, Shandong University, with CEADs team member participation. By coupling 15 global hydrological models driven by ISIMIP2a, five global environmental flow requirement (EFR) methods, and the interregional input-output model EMERGING, the model enables precise tracing of grid-level water boundary exceedance from the consumption side. Based on this model, the study revealed the impacts of consumption activities in 245 economies on water boundary exceedance across multiple spatial scales, including grids, cities, basins, and countries. The related research, titled Tracking grid-level freshwater boundary exceedance along global supply chains from consumption to impact, was recently published in Nature Water. Professor Zhao Xu of Shandong University, Researcher Xiaoxi Wang of Zhejiang University, Professor Jing Meng of University College London, and Professor Klaus Hubacek of the University of Groningen served as co-corresponding authors, while PhD candidate Siyu Hou of the University of Groningen, PhD candidate Jingwen Huo of Tsinghua University, and Professor Zhao Xu of Shandong University were co-first authors.
Based on these findings, CEADs and Shandong University jointly released on the CEADs website a global inventory of water use and water boundary exceedance for 245 economies and 134 sectors in 2015, matched to the EMERGING model. The inventory is now available for free download at https://ceads.net/data/input_output_tables/.
02
Research Results
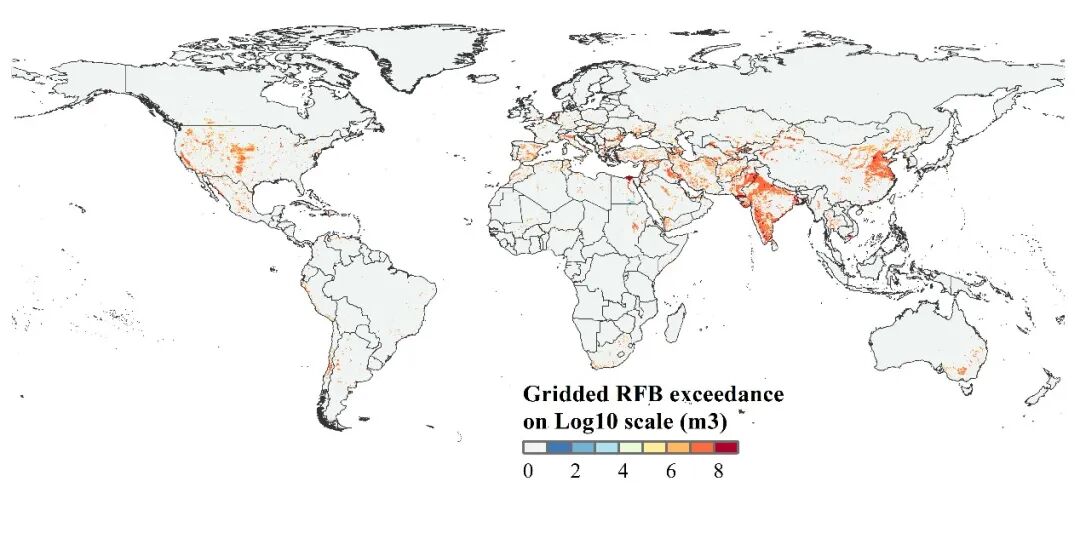
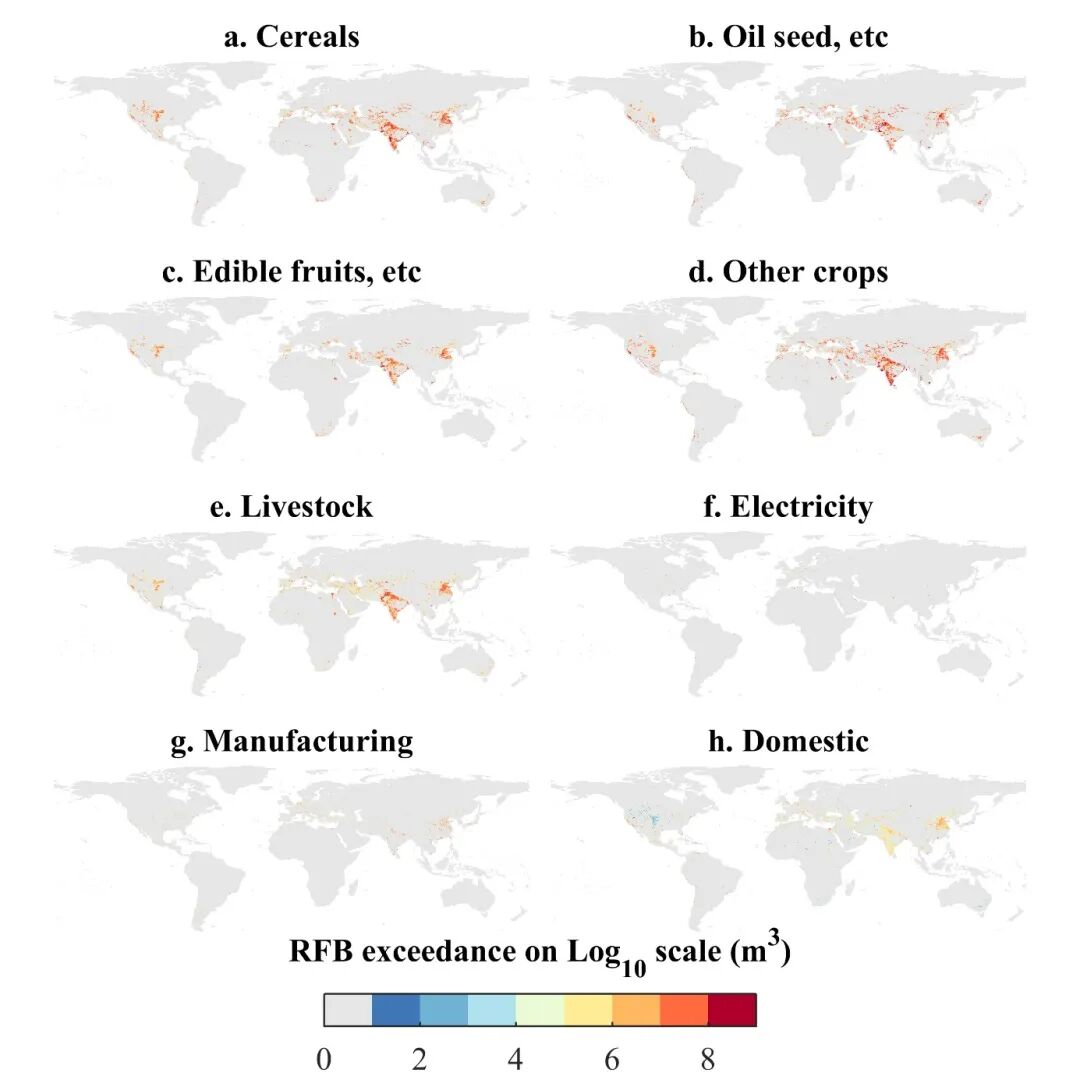
In 2015, total water boundary exceedance at the global 5 arc-minute grid scale reached 3,021 km3, accounting for 64% of total global water withdrawals. Although these exceedance areas covered only 4.6% of the global land area, they encompassed about 42% of the global population, or 3.1 billion people, and were widely distributed across arid and semi-arid regions as well as major agricultural production areas (Figure 1 in the paper). Agricultural irrigation sectors, including cereals, oil crops, edible fruits, and other crops, together contributed 70% of global water boundary exceedance. Irrigation hotspots were spread across major agricultural regions, including the North China Plain, the Tarim Basin, the Indus Basin, the Deccan Plateau, Mesopotamia, the Nile Basin, the Murray-Darling Basin in Australia, basins along the Pacific coast of the Americas, and the Great Plains of the United States (Appendix Figure 1 in the paper). Electricity production accounted for 18% of global water boundary exceedance, and was concentrated mainly in regions with high electricity demand, including the eastern coast of China, the Indian Peninsula, the northeastern United States, and northwestern Europe. Manufacturing accounted for 7% of global exceedance, followed by residential water use, including households and services, at 6%. Hotspots for these two sectors were concentrated mainly in densely populated regions, especially major manufacturing urban agglomerations such as Beijing-Tianjin-Hebei, the Yangtze River Delta, the Pearl River Delta, and the Chengdu-Chongqing cluster in China, as well as Hanoi in Vietnam, the Japan-Pacific Rim urban agglomeration, New Delhi and Mumbai in India, and urban agglomerations in Western Europe and the eastern United States. Livestock contributed 0.2% of global exceedance. The sectoral breakdown provided by this study reveals the contribution of water use by each industry to different exceedance hotspots, a detail often overlooked in previous studies. For example, the exceedance in the Western European and northeastern United States urban agglomerations is mainly attributable to local water demand from electricity production. Such hotspots are often missed by studies that focus only on irrigation or use coarse spatial scales.
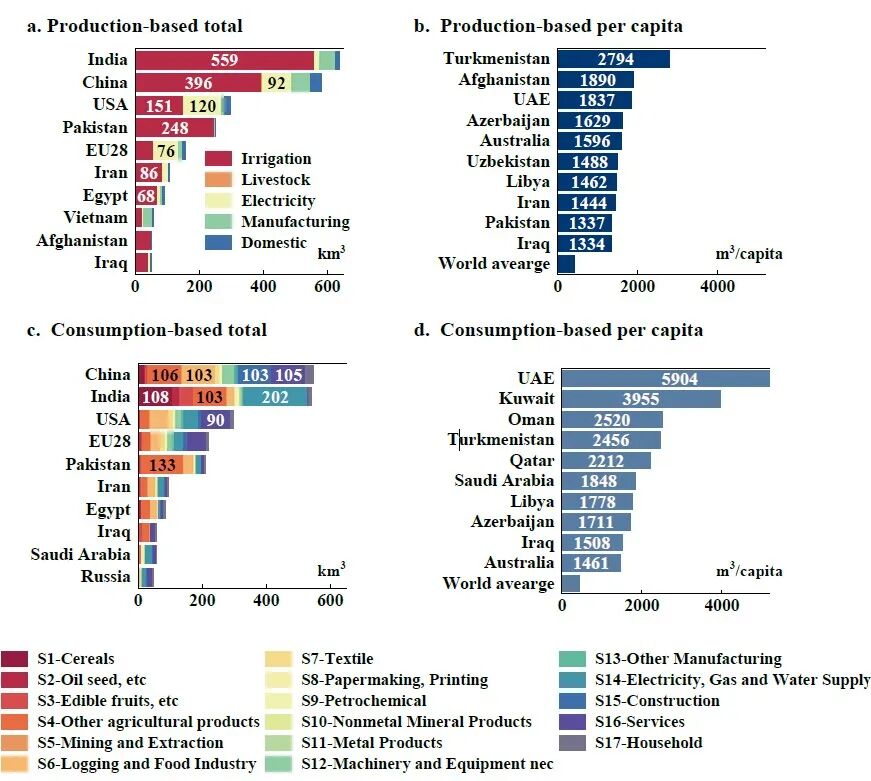
The study further linked grid-scale water boundary exceedance with the consumption impacts of 245 economies and 135 economic sectors worldwide, and found that about 73% of global water boundary exceedance could be traced to consumption demand from ten countries and regions, including China, India, the United States, the European Union, Pakistan, Iran, and Egypt (Figure 2c in the paper). In terms of per-capita consumption-side water boundary exceedance, countries in Central Asia and the Middle East and North Africa (MENA) ranked highest. The per-capita consumption-side water boundary exceedance of the United Arab Emirates, Kuwait, Oman, Turkmenistan, Qatar, Saudi Arabia, Libya, and Iraq exceeded 1,500 cubic meters per person (see Figure 2d). Australia followed at 1,461 cubic meters per person, Canada at 1,032, the United States at 949, and the EU-28 at 496. By contrast, per-capita responsibility among consumers in India and China was below the global average of 435 cubic meters per person.
In 2015, about 24% of water boundary exceedance was embodied in international trade, with grain, oilseeds, edible fruits, and nuts being the main contributing agricultural sectors. Because the EMERGING model includes more countries and sectors, it can identify water boundary exceedance in more emerging and developing countries and trace its consumption-side impacts, something that previous studies could not achieve. The study found that the MENA region externalized 16.2% of its water pressure to Central South Asia by importing sugar, grains, and edible fruits, especially to India, Pakistan, and Iran, which may worsen seasonal water shortages in the Ganges, Indus, and Tigris-Euphrates basins. Hotspots in emerging economies were concentrated in their major cities, such as Tianjin, Shanghai, Guangzhou, Hanoi, Ho Chi Minh City, and Bangkok. These cities have world-class ports, abundant labor, and relatively complete manufacturing bases. Their exports of textiles, machinery, and equipment are the main reason for their water boundary exceedance, and most of those exports flow to developed economies such as Western Europe, Japan, and the United States.
03
Policy Recommendations
Resolving these problems requires the joint efforts of all stakeholders. First, producers in hotspot regions can adopt comprehensive measures including technological progress, industrial upgrading, and adjustments to economic spatial layouts. Since irrigated agriculture is a major driver of water boundary exceedance in many regions, shifting to water-saving technologies such as drip irrigation and micro-sprinkler irrigation can significantly alleviate exceedance in hotspot regions. At the same time, to reconcile industrialization in emerging economies with water depletion, the scale and layout of industries can be determined according to their water boundaries. For regions that may face high upfront investment costs, international cooperation is essential to promote the wide diffusion of new technologies and support the construction of water-saving infrastructure. Second, major importing economies should recognize their role in water boundary exceedance and establish compensation mechanisms. For example, adopting a water tax similar to a carbon tax can help internalize the cost of water scarcity, ensure that consumers bear responsibility for the impacts of global water scarcity, and encourage a shift toward suppliers with abundant water and lower costs. For water-scarce countries that depend heavily on imports, it is crucial to consider the water boundaries of supplier countries when implementing virtual water import strategies. This can help avoid exacerbating water boundary exceedance elsewhere and reduce the risk of food and water crises caused by imports.
Based on planetary boundary theory and environmental flow requirement methods, this study identified hotspot regions of water boundary exceedance across multiple global scales, thereby tracing consumer responsibility for global water scarcity at a finer scale. The grid-level water boundary exceedance inventory provided by the study also offers important scientific support for China to implement its rigid water resource constraint system.
S. Hou#, J. Huo#, X. Zhao#,* , X. Wang*, ..., J. Meng*, K. Hubacek*., et al. Tracking grid-level freshwater boundary exceedance along global supply chains from consumption to impact. Nature Water, 2025. https://www.nature.com/articles/s44221-025-00420-z